tf_cycle_calc
A calculator to convert from different units of temporal and spectral resolution of Morlet wavelets to cycles for time-frequency analysis of M/EEG data.
https://github.com/widmann/tf_cycle_calc
Morlet-type wavelets consist of a (co-)sine wave multiplied by a Gaussian envelope in the time domain and a corresponding Gaussian function in the frequency domain. The temporal and spectral resolutions of a specific wavelet are defined by the "width" of the Gaussian function, that is, the standard deviation σt (typically in seconds) or σf (typically in Hertz).
Many software packages for wavelet-based time-frequency analysis of M/EEG data use "cycles" as unit to define the temporal or spectral resolution of Morlet-type wavelets. Besides causing confusion with wavelet duration, "cycles" as unit is highly opaque and inaccessible and the implications of changes to this parameter are not always obvious. For example, a linear change in cycles from low to high frequencies, as is commonly done, could mislead one into assuming that the wavelet temporal or spectral resolution changes linearily with cycles. However, this is not the case. Cohen (2019) suggested to better define the resolution as the "full width at half maximum" (FWHM) of the Gaussian function (cf., Figure 1). He implemented this by adjusting the functions used for wavelet generation in the time or frequency domain. While valuable, this suggestion cannot (easily) be applied to existing software packages.
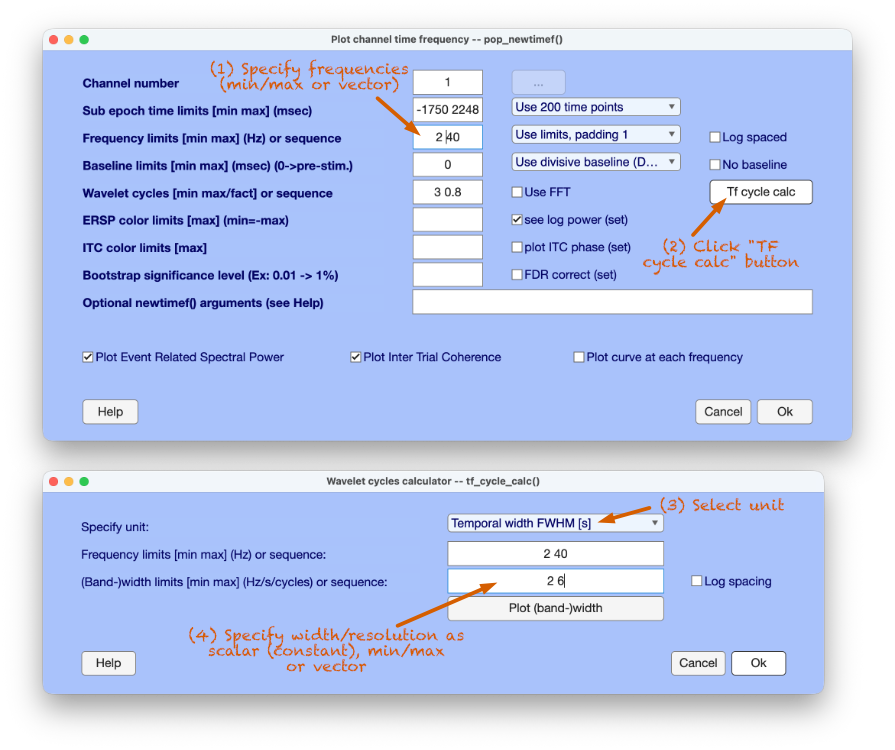
The TF cycles calculator computes the cycles parameter from different units of temporal or spectral resolution, including temporal and spectral FWHM, σt and σf, 2 σt and 2 σf per wavelet center frequency. The calculator can also convert from cycles to any unit and report and visualize the wavelet resolution per center frequency. This is useful for appropriately reporting resolution in publications, for example. The calculator can be used on the MATLAB command line or as an EEGLAB GUI function, which can be called from the pop_newtimef EEGLAB GUI.

The FWHM unit is closely related to the -6 dB cutoff frequencies that are typically reported in spectral filtering for band-pass filters. Many manuscripts applying the Morlet wavelet transform traditionally reported 2 σt and/or 2 σf units (e.g., Tallon-Baudry et al., 1996).
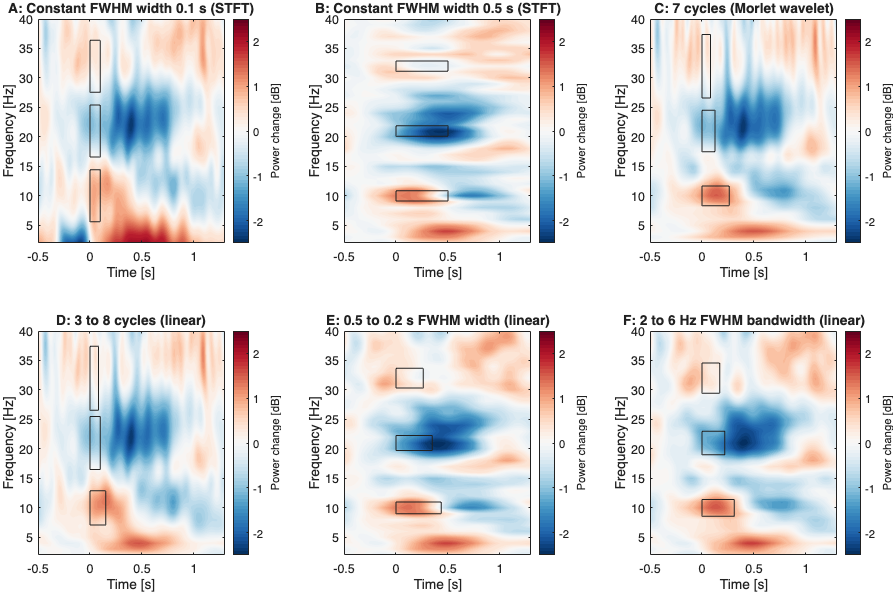
An example application can be found in demo_cohen2019.m which results in
Figures 2 and 3 below. This conceptually replicates Figure 5, Panels A and B
from Cohen (2019) using the provided demo data. The TF transforms are
displayed in Figure 2. The boxes indicate the temporal and spectral FWHM at
low, intermediate and high frequencies (note that the area of all boxes is
constant). The effects of parameter selection on different features of the TF
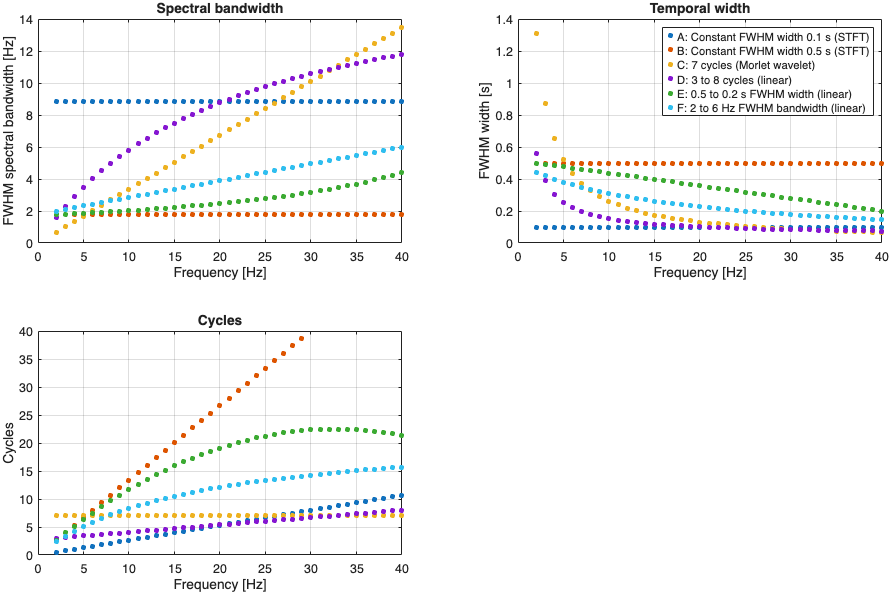
decomposition are evident. Figure 3 visualizes the corresponding temporal and
spectral wavelet resolutions and cycles per wavelet center frequency.
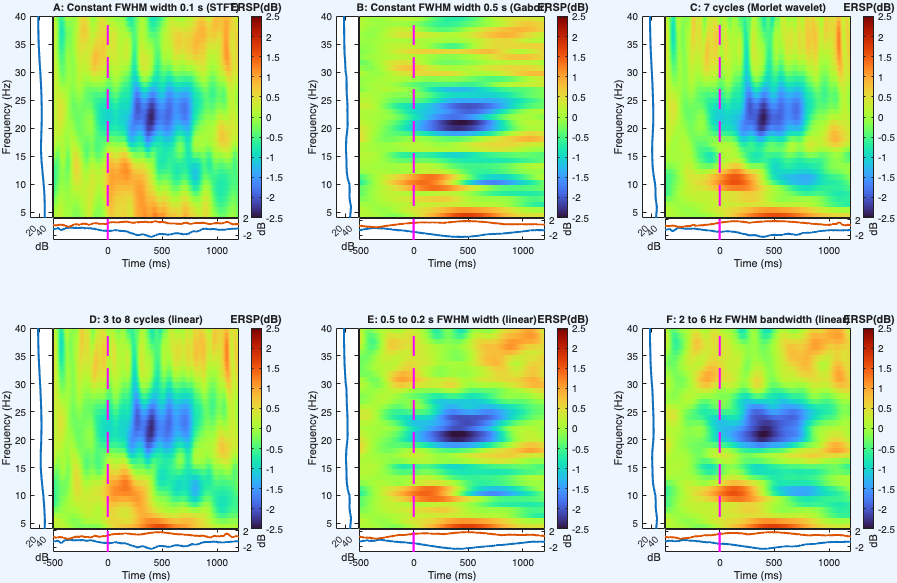
demo_cohen2019_eeglab.m replicates Figure 2 using EEGLAB's pop_newtimef
function (rather than the built-in simple TF transform intended for
demonstration purposes). The output is displayed in Figure 4.
CLI example
[cycles, widths_table] = tf_cycle_calc('freqs', 2:2:40, 'width', [0.5 0.2],
    'width_unit', 'fwhm_t', 'log_spaced', 0, 'plot', 1)
Requested 'width' is specified per frequency or as min/max (interpolated in
linear or log spaced steps accordingly). If a scalar value is specified it is
held constant for all frequencies, that is, STFT (Gabor transform) is computed
in case of FWHM, 2 σ, or σ, and Morlet wavelet transform in case of cycles.
The widths_table output reports the wavelet resolution per frequency in the
units cycles, spectral FWHM, temporal FWHM, 2 σf, 2 σt, σf, and σt.
GUI example
References
- Cohen, M. X. (2019). A better way to define and describe Morlet wavelets for time-frequency analysis. Neuroimage, 199, 81-86. DOI: 10.1016/j.neuroimage.2019.05.048.
- Tallon-Baudry, C., Bertrand, O., Delpuech, C., Pernier, J. (1996). Stimulus specificity of phase-locked and non-phase-locked 40 Hz visual responses in human. J Neurosci, 16(13), 4240-4249. DOI: 10.1523/JNEUROSCI.16-13-04240.1996.